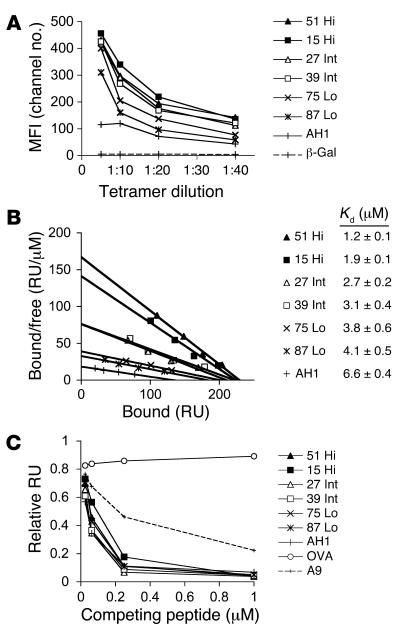
Figure 1. Affinity characterization of mimotope peptides.
(A) Relative avidities of the TCR-pMHC interactions were determined by staining a T cell clone that recognizes the AH1 peptide with increasing concentrations of Ld-tet incubated with the indicated peptides. The H-2Ld–restricted β-gal peptide (64) did not bind the TCR from the T cell clone. Data are presented as mean fluorescence intensity (MFI) and are representative of 3 independent experiments. (B) Affinity binding analysis of the pMHC complexes for the TCR from the T cell clone were determined using SPR. Increasing concentrations of soluble H-2Ld monomers incubated with peptide were exposed to the immobilized TCR on a biosensor surface. Equilibrium-binding measurements were used to construct Scatchard plots. Kd values were calculated by nonlinear regression analysis of the response units plotted against H-2Ld concentration (Prism, version 4.0; GraphPad Software). (C) Relative affinities of the peptides for H-2Ld were determined using competition assays. The indicated peptide concentrations and 40 μM monomeric H-2Ld were exposed to the immobilized pMCMV-C4 peptide on a biosensor surface. The amount of H-2Ld bound to pMCMV-C4 is reflected by the change in RU after 1 minute. Data are presented as RU relative to binding of empty H-2Ld to the MCMV-C4 peptide. Hi, high affinity; Int, intermediate affinity; Lo, low affinity.

