
Figure 1.
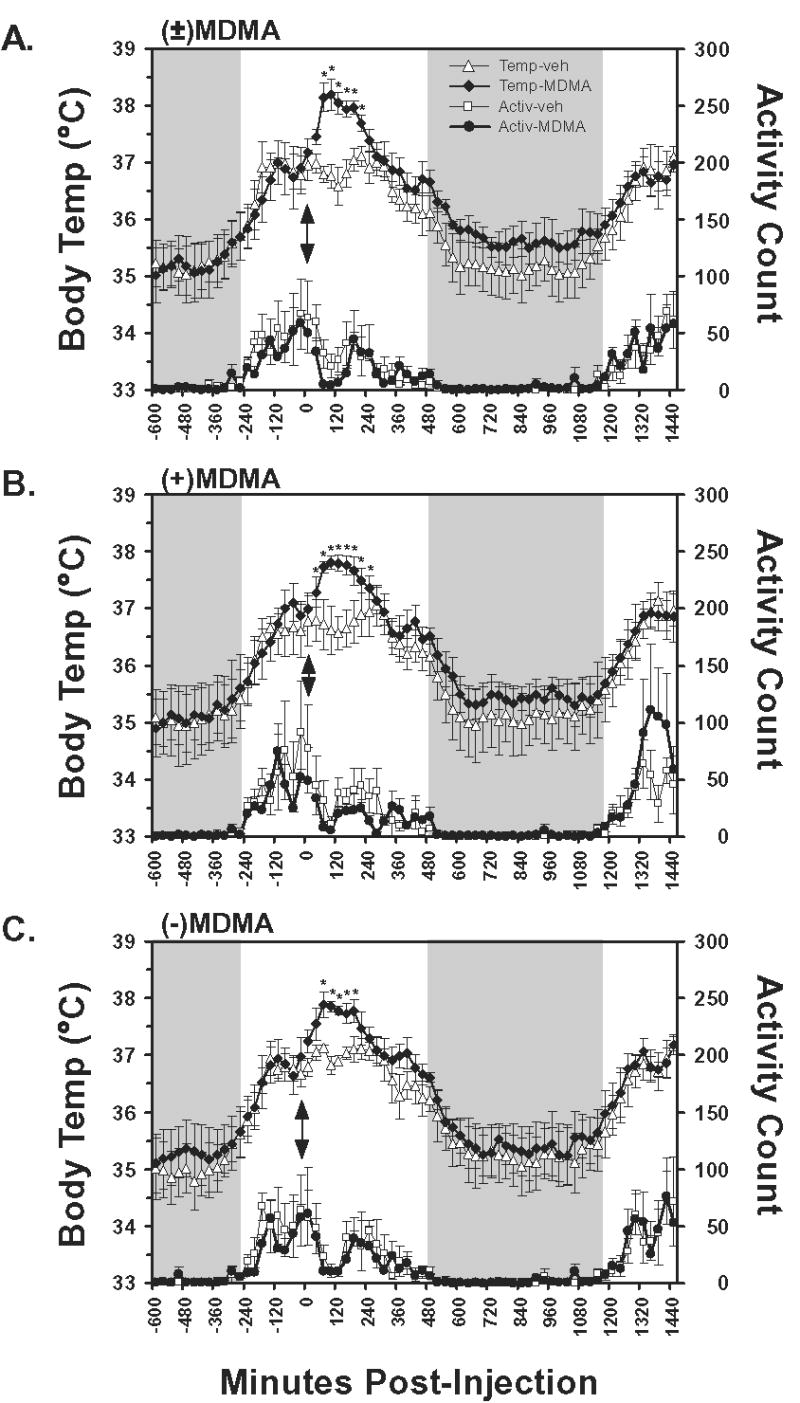
The mean (N=4, bars indicate SEM) subcutaneous temperature and activity values following A) racemic MDMA, B) S(+)MDMA and C) R(−)MDMA, as well as the respective vehicle challenges, are presented. Temperature values are an average of three sequential 10-min interval samples and activity data represent the average of summed activity counts across three sequential 10-min intervals. Injections were made at 1030 for all conditions, thus the data represent the interval from midnight prior to injection to 1030 the following day. Shaded regions indicate the night period during which the room lights are off and arrows indicate the time of injection. A significant increase from both the 30-min timepoint preceding injection and the corresponding vehicle timepoint is indicated by *. Additional differences of significance are detailed in the Results.