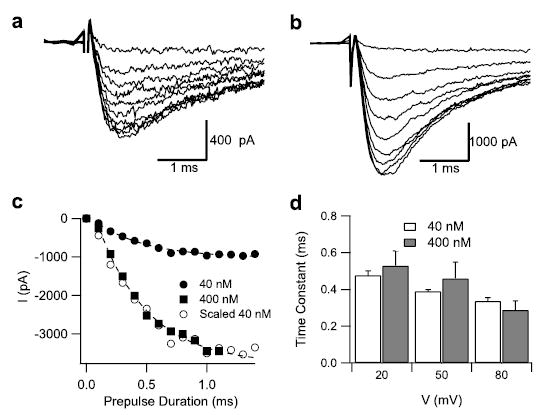
FIGURE 2. Dependence of the rate of shift of the voltage dependence of activation on Css IV concentration.

Currents were elicited at −65 mV, 60 ms after conditioning pulses to +20 mV of variable durations 0.1 (smallest current) to 1.4 s (largest current). a, in the presence of 40 nm Css IV; b, in the presence of 400 nm Css IV; c, current amplitude plotted against the duration of conditioning pulse in the presence of 40 nm Css IV (filled circles) or 400 nm Css IV (filled squares). The open circles are a scaled version of the 40 nm data. Note that the amount of current elicited at −65 mV in 400 nm Css IV is greater than in 40 nm Css IV. d, time constants for development of currents at −65 mV at conditioning pulses of 20, 50, and 80 mV in the presence of 40 nm (white) or 400 nm (gray) Css IV. The dashed lines are fits to the 40 and 400 nm data with a time constant of 0.42 ms.
