
FIGURE 3. Kinetics of voltage sensor trapping at different membrane potentials.
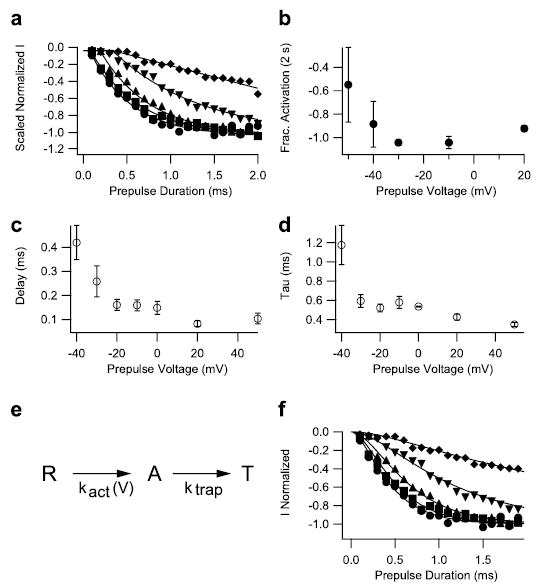
a, prepulses of duration varying from 0.1 to 2 ms in 0.1-ms steps were applied to −50 mV (diamonds), −40 mV (inverted triangles), −30 mV (triangles), −10 mV (squares), and +20 mV (circles). The membrane potential was then returned to −120 mV for 61.2 ms followed by an 11-ms test depolarization to −65 mV to detect channels with modified activation. Test pulse currents in each experiment were normalized to those obtained during test pulses after 2-s prepulses to potentials >−10 mV. Such prepulses produced a maximal effect. Mean normalized test-pulse currents are plotted as a function of prepulse duration. The solid lines are fits of a function, including a delay and an exponential (see c legend). b, mean normalized activation after 2-s pulses to the indicated potentials. c and d, onsets at each potential were fit with an exponential function incorporating an initial delay, I = Imax(1 − exp−[(t −d)/τ]), where Imax is the maximum current, d is a delay, and τ is the time constant of the exponential change. The values of d and τ as a function of voltage are plotted in panels c and d, respectively. e and f, the time-course data from a were simulated with the three-state model depicted in e, where R is the resting state, A is a state where the voltage sensor is activated, and T is a state where the voltage sensor is trapped by the toxin. The rate constant for the transition from R to A is voltage-dependent, whereas the rate constant for the transition from A to T, ktrap, is voltage-independent. The solid curves in f were simulated using ktrap = 3 ms−1 at all potentials. Rate constant kact was 0.35 ms−1 at −50 mV, 1.1 ms−1 at −40 mV, 2.8 ms−1 at −30 mV, 4.8 ms−1 at −10 mV, and 7 ms−1 at +20 mV.