Figure 3.

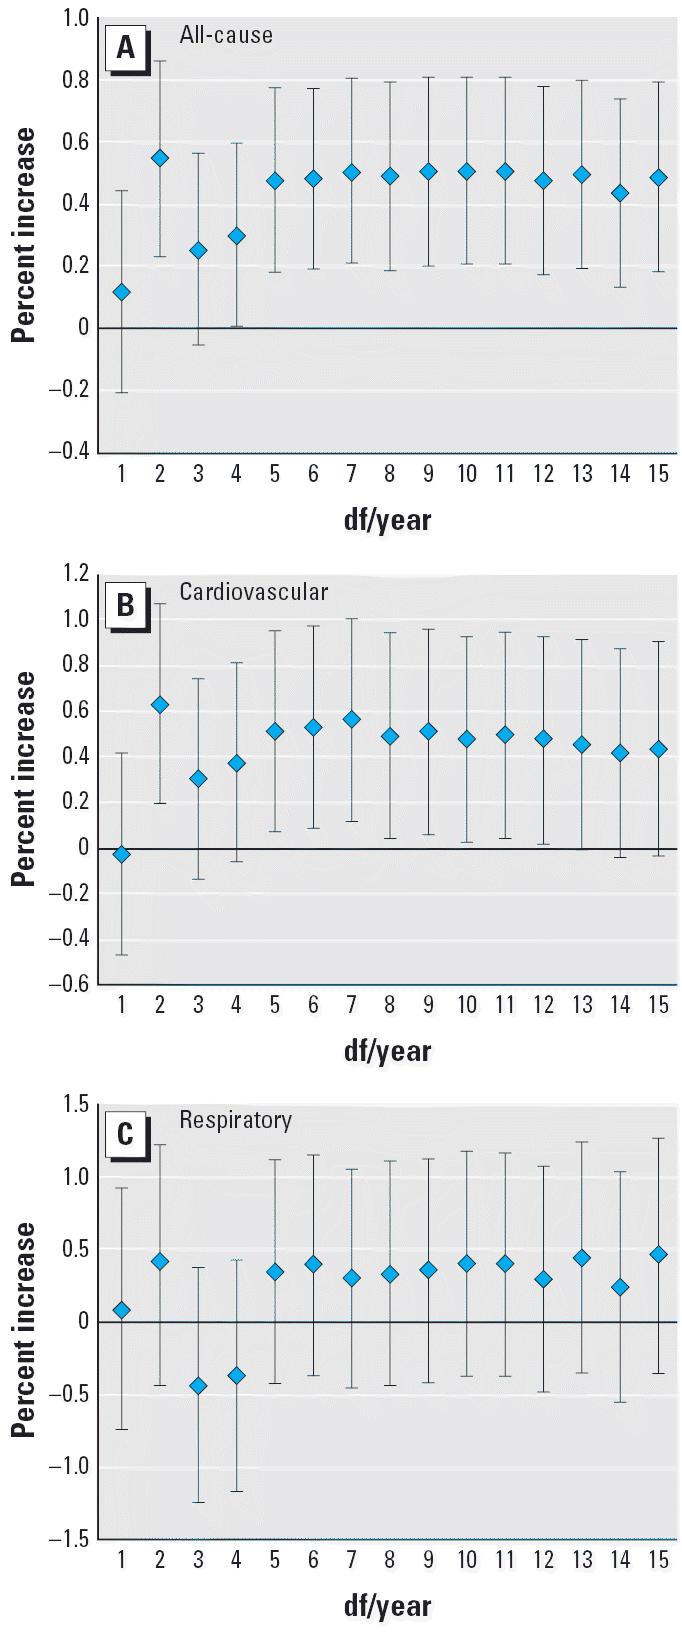
Percent increase of deaths with 10 μg/m3 increase of O3 due to all, cardiovascular, and respiratory causes classified by degrees of freedom per year. (A) All-cause mortality. (B) Cardiovascular mortality. (C) Respiratory mortality.

Percent increase of deaths with 10 μg/m3 increase of O3 due to all, cardiovascular, and respiratory causes classified by degrees of freedom per year. (A) All-cause mortality. (B) Cardiovascular mortality. (C) Respiratory mortality.