
Figure 1.
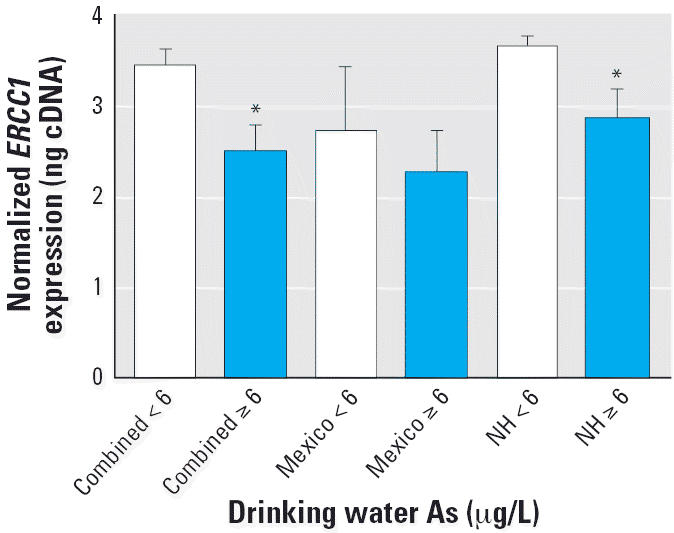
ERCC1 gene expression (mean ± SE) by drinking water As level for individuals from the New Hampshire (NH) and Mexican populations and for both populations combined (n = 53). ERCC1 levels were assessed by RT-PCR and normalized to 18s or GAPDH as described in “Materials and Methods.”
*Statistically significant compared to the ≤ 5 μg/L group (p < 0.05).