Fig. 1.
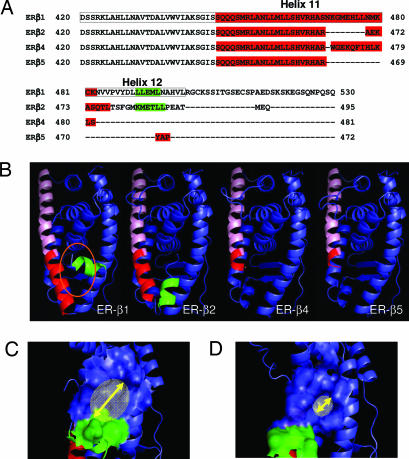
Protein sequence analysis and molecular modeling of ER-β isoforms. (A) Protein sequence alignment of the C-terminal regions of ER-β1, -β2, -β4, and -β5 by using the Clustalw alignment program. The ligand binding domain of ER-β1 is boxed. The protein sequence forming helix 11 in each isoform is shown in red, whereas the protein sequence participating in helix 12 is in green. (B) Molecular models of ER-β isoforms. The common helix 11 region of each isoform is labeled in pink, whereas the isoform-specific region of helix 11 is highlighted in dark red. The orientation of helix 12 (green) in ER-β2 is different from that of ER-β1, which has “tight” configuration in the ER-β1 binding pocket (orange oval). (C and D) Molecular models of ER-β1 (C) and ER-β2 (D) show the coactivator binding pocket created by electrostatic potential of the amino acid residues in helices 3–5 and 12. The size of the coactivator binding pocket in ER-β2, which is indicated by a yellow arrow, was determined, by using PyMol software, to be smaller than that of ER-β1.

