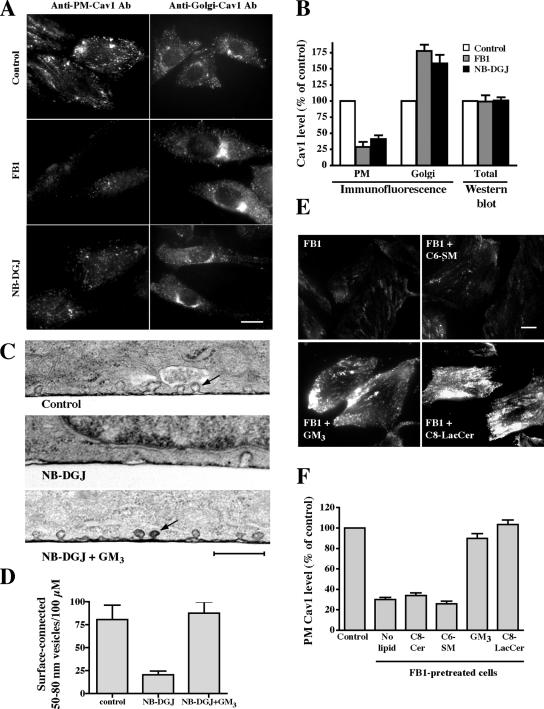
Figure 5.
Effect of SL depletion on Cav1 distribution and the number of surface-connected, 50- to 80-nm vesicles at the PM of CHO-K1 cells. Cells were untreated (control) or pretreated with FB1 or NB-DGJ for 2 d. (A) Samples were permeabilized with methanol and stained with anti-PM-Cav1 or permeabilized with 0.1% saponin and stained with anti-Golgi-Cav1 antibodies (Pol et al., 2005). Cells were then incubated with fluorescent secondary antibodies, and staining was observed by fluorescence microscopy. Bar, 10 μm. (B) Samples treated and stained for Cav1 as described in A were analyzed for PM (anti-PM-Cav1-antibody) and Golgi (anti-Golgi-Cav1 antibody) Cav1 signal intensity by microscopy and image analysis. Note that the values shown for “Golgi” represent quantitation of entire cell fluorescence detected with the anti-Golgi-Cav1 antibody (see A). No differences in the total amount of Cav1 were detected by Western blotting of cell lysates from control, FB1-, or NB-DGJ–pretreated cells (B). (C andD) Cells were untreated (control), pretreated with NB-DGJ for 48 h, or pretreated with NB-DGJ for 48 h and then with GM3 ganglioside for 30 min at 10°C. Cells were then stained with ruthenium red to identify surface-connected invaginations, fixed, and processed for transmission EM. Samples were sectioned vertically to the substratum. (D) For quantitation, the entire circumference of a given cell in a single section was analyzed. Values represent the number of 50- to 80-nm surface-connected vesicles within 0.5 μm of the cell surface and are expressed as number per 100 μm of length. In total, 30 different cells were analyzed for each condition in three independent experiments. Note that the NB-DGJ–treated cells showed approximately threefold reduction in the number of these vesicles per unit length. Bar, 500 nm. (E) Cells treated with FB1 were incubated with exogenous lipids for 30 min at 10°C and then fixed and stained for PM-Cav1 immunofluorescence as described in A. Bar, 10 μm. (F) Quantitation of PM labeling in cells treated with FB1 plus exogenous lipids as described in E. Results are means+ SE for ≥30 cells from three independent experiments for each condition shown.

