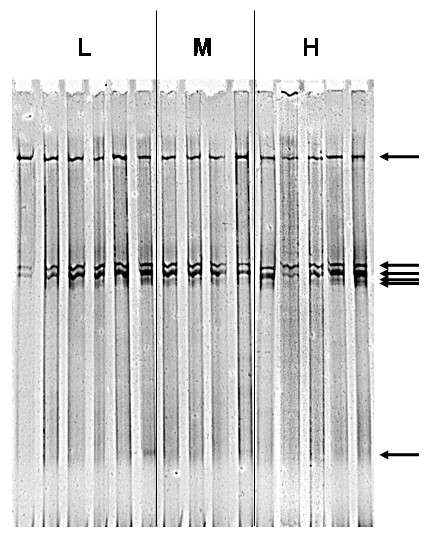
Figure 1.

Example of TTGE band pattern (arrow: operational taxonomic unit, OTU) of DNA extracted from soil samples exposed to different levels of plant biodiversity and carbon dioxide. H: high diversity level (31 plant species); M: medium diversity level (12 plant species); L: low diversity level (5 plant species). Image was photographically enhanced using Photoshop.
