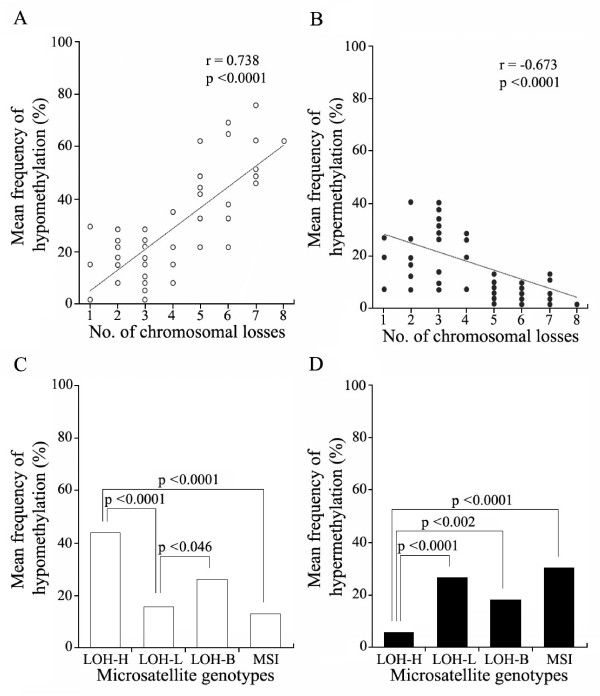
Figure 6.

Relationships between methylation alterations and the number of chromosomal losses in gastric cancers. The frequency of hypomethylation (A) and hypermethylation (B) detected in 14 transitional CpG amplicons was plotted as a function of the chromosomal losses. The correlation coefficients were calculated using Pearson's correlation analysis. The correlation between methylation alterations and chromosomal losses is shown with the line of best fit. The mean frequency of hypomethylation (C) and hypermethylation (D) was compared among four microsatellite genotypes.
