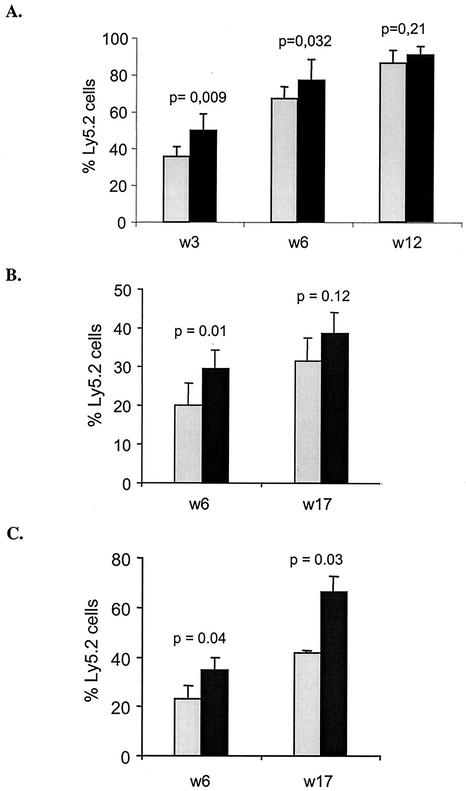
FIG. 6.
Reduced regenerative capacity of Hoxb3/Hoxb4-deficient repopulating FL and BM HSCs after BM transplantation. The donor cells (Ly5.2) were injected together with competitor B6.SJL cells (Ly5.1) into lethally irradiated recipients. The figure shows in vivo reconstitution of Hoxb3/b4−/− (shaded bars) and Hoxb3/b4+/+ (littermates, solid bars) derived donor cells. (A) Repopulation of FL cells in B6.SJL recipients over time showing slower regeneration at 3 and 6 weeks but full regenerative potential at 12 weeks. (B) Repopulation of BM HSCs in B6.SJL mice. Level of reconstitution in primary transplanted recipients (each bar represents 16 recipients from four donor mice). Shown here is the percentage of reconstitution of Ly5.2 derived cells in the PB at 6 and 17 weeks posttransplant (± the standard error of the mean) from two experiments. (C) Ly5.2 reconstitution in secondary transplant recipients determined by using cells from primary mice (BM recipients) included in the competitive transplantation study depicted in panel B. BM cells (106) from four primary recipients (two Hoxb3/b4−/− and two Hoxb3/b4+/+) were injected into lethally irradiated B6.SJL mice, and the overall reconstitution was analyzed as described in the text. Each bar represents six recipients derived from two primary donor mice. The result (i.e., the percentage of Ly5.2 ± the SD) from one experiment is shown.

