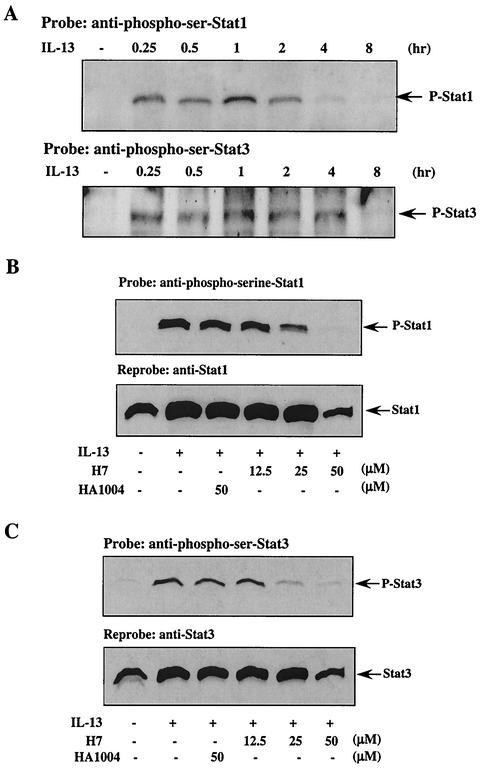
FIG. 3.
IL-13 induces Stat 1 and Stat 3 serine phosphorylation. (A) Freshly isolated human blood monocytes (10 × 106 per group) were treated with IL-13 (500 pM) for different time intervals or left untreated as indicated. The cells were lysed, and the nuclear extracts (10 μg/lane) were loaded on an SDS-8% PAGE gel and immunoblotted with anti-phosphoserine-Stat1 (p-Stat1) and anti-phosphoserine-Stat3 (p-Stat3) antibodies. The arrows indicate the positions of Stat1 (91 kDa) and Stat3 (89 kDa) based on the migration of molecular size markers in adjacent lanes. (B and C) Monocytes (5 × 10⁶/well) were treated for 30 min with H7 or HA1004 at various doses, followed by IL-13 treatment (500 pM) for an hour. The cells were then harvested and lysed, and 50 μg of the whole-cell extract was loaded in each lane on an SDS-8% PAGE gel and immunoblotted with anti-phosphoserine-Stat1 (B) and anti-phosphoserine-Stat3 (C) antibodies. These blots were stripped and reprobed with Stat1 and Stat3 antibodies, respectively, as loading controls and are shown in the lower panels.

