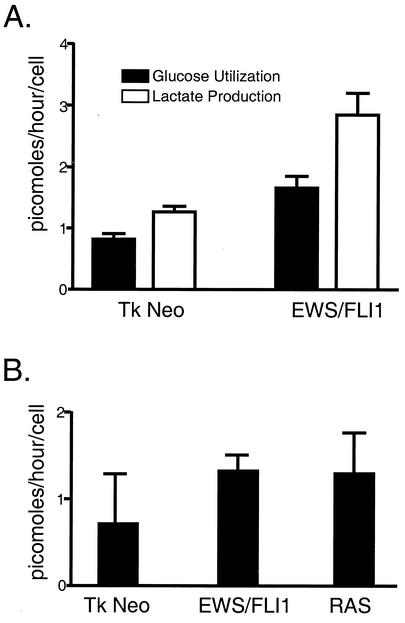
FIG. 3.
Analysis of glucose utilization in response to EWS/FLI (A) and in response to EWS/FLI1 and RAS (B). The amount of glucose and lactate utilized is represented as picomoles (of substrate produced or utilized) per hour per cell. These experiments were performed in quadruplicate and are representative of three independent experiments.

