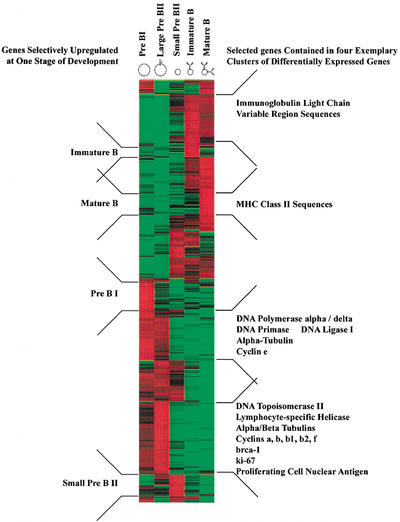
Figure 2.
Hierarchical cluster analysis of 1406 differentially expressed genes as detected by ANOVA with 98% confidence (measured by Kruskal-Wallis statistics) with a change of at least twofold and a difference of at least 100 average difference units (for details see Methods). Genes are organized in rows, whereas the five columns represent the five developmental stages from the most immature, pre-BI compartment on the left to the most mature compartment, mature B cells on the right. The expression level of every gene for every developmental stage has been normalized. Green denotes a normalized expression level below, black near to, and red above the mean. Developmental stage-specific clusters are indicated on the left and clusters of selected functional classes of genes are indicated on the right side of the plot.

