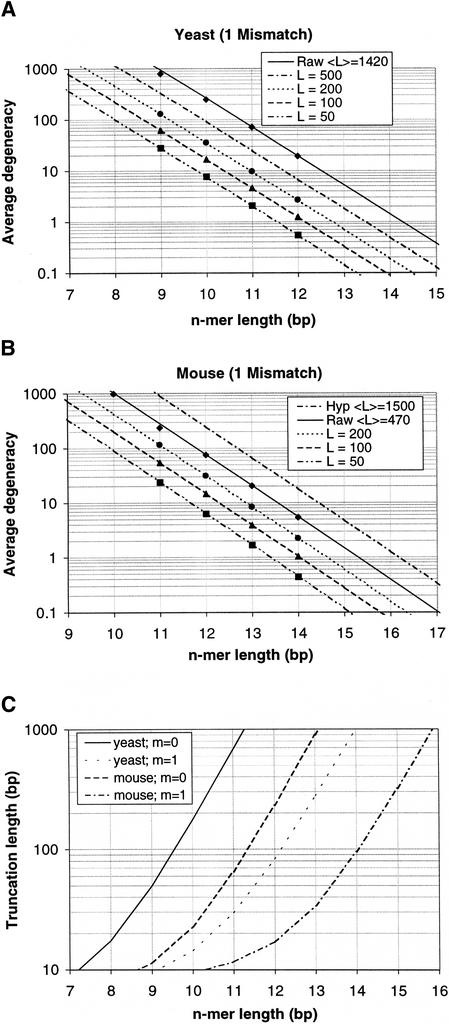
Figure 2.
Predictions of average degeneracy compared with calculations from actual sequence data for the case of 1 mismatch for yeast (A) and mouse (B). Continuous lines represent predictions (with no fitted parameters) of average degeneracy as a function of the n-mer length n for varying degrees of transcript length truncation to a fixed length L, computed from Equation 2 with modifications for mismatches and length truncation. (Raw designates the untruncated cases). Discrete points represent the actual average degeneracy values. Owing to the presence of many ESTs in the mouse UniGene database, the average transcript length for mouse is reported as much lower than yeast, so we have included a predicted curve for a hypothetical average gene length of 1500 bp. (C) Predicted relationship between parameter values to achieve an average degeneracy of 1 (the trivial case).

