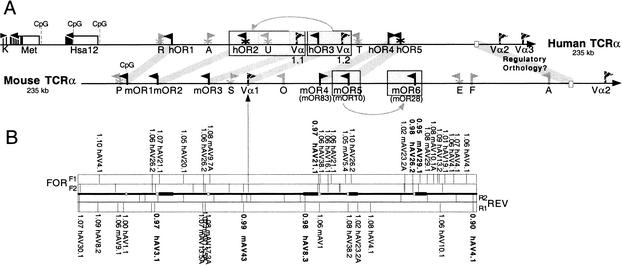
Figure 1.
Gene map and RSS profiling of the olfactory receptor regions 5′ to the mouse and human TCR-α/δ loci. (A) The ∼200-kb regions upstream of the TCR-α/δ loci are shown. Olfactory receptor (OR) genes are shown as black flags, and putative orthologs are indicated by thick gray lines that connect the mouse and human maps. The five human OR genes were named OR10G3, OR10G1P, OR10G2, OR4E2, and OR4E1P by Glusman et al. (2001). The mOR4, mOR5, and mOR6 genes are identical to previously identified mOR83, mOR10, and mOR28 OR genes, respectively (Tsuboi et al. 1999). V-gene segments are shown as striped flags (Vα). The position of a conserved 2-kb region of putative regulatory orthology is shown as open rectangles within the ∼80-kb region identified previously by Serizawa et al. (2000). Processed pseudogenes are shown as gray flags (R: retinoblastoma-binding protein-like; A: Arp3/actin2-like; U: ubiquitin-like; T: TBX2-like; P: proteosome component C8-like; S: signal peptidase-like; O: ODR4-like; E: enolase-like; F: FBRNP-like; AT: ATPase-like). Multiexon genes (K: Accession Code KIAA0737; M6A: methyl-transferase; ZNF: Hsa12 zinc finger genes) are indicated by black arrows, and individual exons are indicated by vertical lines (width according to exon size) beneath these arrows. In all cases, flags point in predicted transcriptional directions, and “X's” on the stems indicate pseudogenes. Block duplications are shaded and boxed. (B) RSS profiling for both strands (FOR, REV) of the mouse OR region. For each direction, the outer rectangles (F1, R1): A Hamming distance was computed between every known functional Vα and Vδ segment RSS for every position in the region. Positions (along with scores and the name of the most similar Vα-gene-segment RSS outside the rectangle) below cutoff threshold 1.1 are indicated in the figure (vertical lines within the rectangles for both strands). Stronger RSS signals below cutoff threshold 1.0 are bolded. The inner rectangles (F2, R2): the positions of conserved heptamer motifs (CACAGTG). Open boxes between forward and reverse plots indicate positions of OR coding sequences. Closed rectangles upstream of the mOR2, mOR4, mOR5, and mOR6 open boxes indicate the positions of 5′ UTRs (introns and exons).

