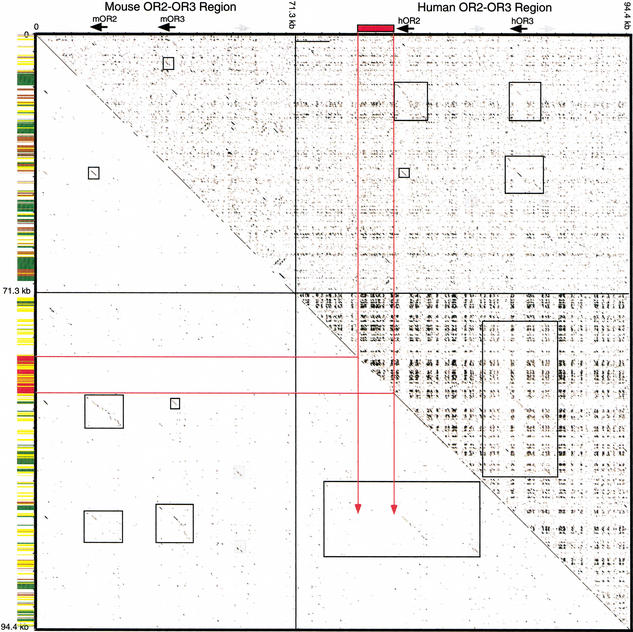
Figure 3.
Dotplot analysis of the mOR2-mOR3 and hOR2-hOR3 region. A concatenated sequence file containing 71.3-kb mouse genomic sequence surrounding the mOR2-mOR3 region and 94.4-kb human genomic sequence surrounding the hOR2-hOR3 region was plotted against itself. Above the diagonal is the plot of unmasked sequence; below the diagonal is a plot of RepeatMasker sequence. Breaks in the diagonal line indicate positions of masked repeats. Along the vertical axis, repeat content is summarized by color-coded bars: low complexity (light gray), simple repeats (dark gray), LTRs (brown), SINEs (yellow), LINEs (green), and the L1MA4 noted in the text (red). Along the top axis, black arrows indicate the positions of the mOR2, mOR3, hOR2, and hOR3 coding regions; gray arrows indicate the positions of Vα1 gene segments; red rectangles indicate the position of the L1MA4 repeat inserted within the hOR2 block. Within the plot, red lines indicate the regions of the L1MA4 repeat. The duplication unit extends beyond the L1MA4 repeat, although this is not obvious in the dotplot because the sequences preceding the insertion are short and disrupted by numerous Alu repeat insertions. Black boxes in the plot surround homologous portions of the OR gene blocks. The Vα1 gene homology is noted with light gray shaded boxes in the plot. Note that the mOR2 block has more extensive homology with the hOR2 block than the hOR3 block, and the mOR3 block has more extensive homology with the hOR3 block than the hOR2 block (upper right/lower left quadrants). Also note the extensive hOR2 and hOR3 paralogous block homology (lower right quadrant) as compared to the mOR2 and mOR3 paralogous blocks, which are more significantly diverged (upper left quadrant).

