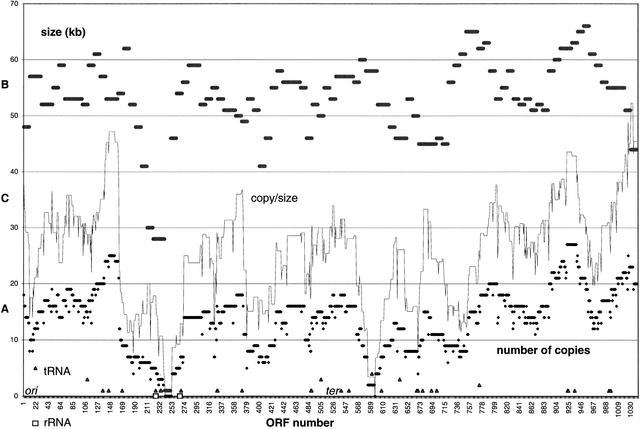
Figure 2.
A (lower plot): Plot of the number of ORF (gene) copies present in the library calculated for each individual ORF. The copy numbers varied from 0 to 27 with an average of 13.7 copies per library. Altogether, 13 genes were missing in the library (TP0241–TP0252, TP0596). B (upper plot): Plot of the average insert size calculated for 104 10-ORF windows of the T. pallidum chromosome. BAC clones harboring at least one ORF from each 10-ORF window were used for calculation of average insert size within this window. C (middle plot): Plot of the ratio between gene copy number and window average insert size ranging between 0 and 0.52. Open triangles represent number (1–5) and position of tRNA genes, whereas open squares represent the positions of two 3-gene rRNA clusters. The possible origin (ori) and terminus (ter) of replication regions are indicated.

