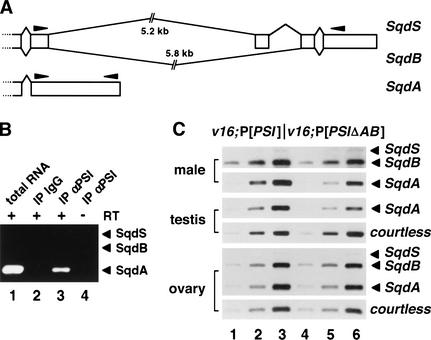
Figure 5.
Analysis of the hrp40/squid pre-mRNA splicing pattern in v16;P[PSIΔAB] mutants. (A) Schematic diagram of the Sqd transcripts. Broken lines and open boxes represent intronic and cDNA sequences, respectively. The position of the PCR primers used in B and C is indicated by solid arrowheads. (B) RT–PCR reactions using embryonic RNA samples were performed and analyzed as in Figure 4B in the presence of three PCR primers to amplify all of the sqd transcripts. No SqdB/S isoforms were detected. (C) Quantitative RT–PCR experiments were performed as in Figure 4C with polyA+ RNA isolated from adult males or 5, 10, and 20 ng of total RNA purified from testes or ovaries hand-dissected from v16;P[PSI] (lanes 1–3) or v16;P[PSIΔAB] (lanes 4–6) transgenic flies. The top panel (SqdB/SqdS) presents an exposure of the gel six times longer than for the SqdA panel to clearly display the weakly expressed SqdS transcript in males.

