
Fig. 5.
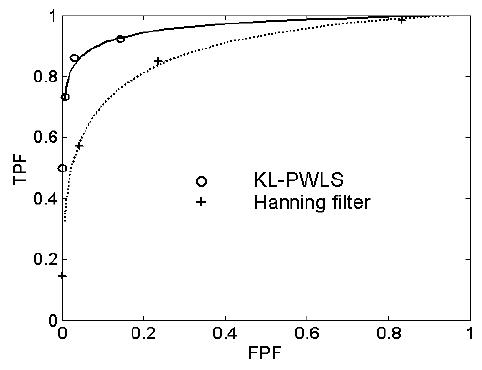
Results of ROC evaluation and the fitted ROC curves of the binormal model. The solid line (and circles) represents the result of the KL-PWLS scheme and the dashed line (and crosses) stands for the result of the Hanning filter.
Official websites use .gov
A
.gov website belongs to an official
government organization in the United States.
Secure .gov websites use HTTPS
A lock (
) or https:// means you've safely
connected to the .gov website. Share sensitive
information only on official, secure websites.
Results of ROC evaluation and the fitted ROC curves of the binormal model. The solid line (and circles) represents the result of the KL-PWLS scheme and the dashed line (and crosses) stands for the result of the Hanning filter.