
Figure 2.
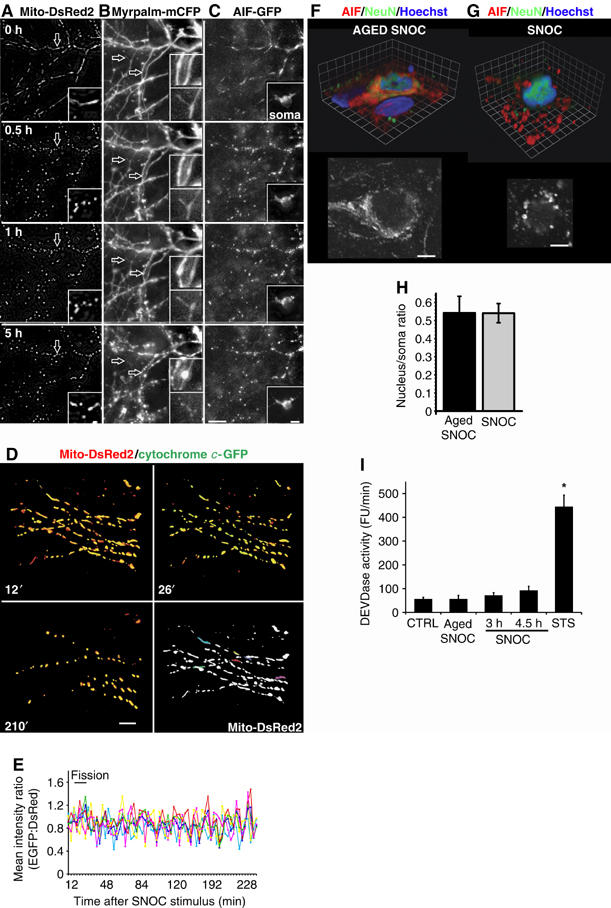
Mitochondrial fission occurs before dendritic injury and without AIF or cytochrome c release from mitochondria. Neurons were co-transfected with vectors encoding (A) Mito-DsRed2 and (B) MyrPalm-mCFP plus (C) AIF-GFP and the effects of SNOC were recorded using 3D time-lapse imaging. Projection images zoomed in onto the dendritic arbor of one neuron (representative of n=42). Arrows indicate dendritic spines. The inset shows the soma at appropriate grayscale levels. The apparent brightening of AIF-GFP fluorescence in the nucleus at 5 h was due to nuclear and cell body shrinkage rather than nuclear translocation of AIF. Scale bars, 10 μm. See also Supplementary Video 2. (D–E) Neurons transfected with Mito-DsRed2- plus cytochrome c-GFP were exposed to 300 μM SNOC. 3D time-lapse images were captured by fluorescence deconvolution microscopy and analyzed using Volocity software. (D) 3D time-lapse image reconstructions of mitochondria and cytochrome c in a dendritic arbor at indicated time points following SNOC addition. Scale bar, 10 μm. Five mitochondria were selected and motion tracked throughout the imaging series. (E) Traces show the ratio of mean GFP to DsRed2 emission intensity from each mitochondrion. Each trace color corresponds to the same colored mitochondrion. (representative of n=9) (F–G). Immunocytochemistry for staining anti-AIF antibodies (red) anti-NeuN antibodies (green) and nuclei labeled with Hoechst 33342 dye (blue) after (F) aged SNOC or (G) SNOC (150 μM; 4 h) treatment. Volume rendered 3D reconstruction of confocal image stacks are shown above, and a single confocal plane in grayscale below. Grid, 3.3 μm for (F) and 1.9 μm for (G), scale bars, 5 μm. (H) Ratio of nuclear to somal AIF signal was measured as mean fluorescence intensity in the center of nuclei divided by the mean fluorescence intensity in the cell body, outlined by the NeuN staining (excluding the nucleus). The bar diagram summarizes the mean±s.e.m. of 282 and 262 neurons measured in n=19 and 20 image stacks in three independent experiments for aged SNOC and SNOC, respectively (P∼0.99 not significant by Student's t-test). (I) DEVDase activity. Purified cortical neurons were exposed to either 200 μM SNOC or 1 μM staurosporine, as positive control. The rate of zDEVD-AMC caspase substrate cleavage per minute was monitored and expressed in arbitrary fluorescence units. Data show mean±s.e.m. for four independent experiments (*significance at P<0.01 by ANOVA).