
Figure 5.
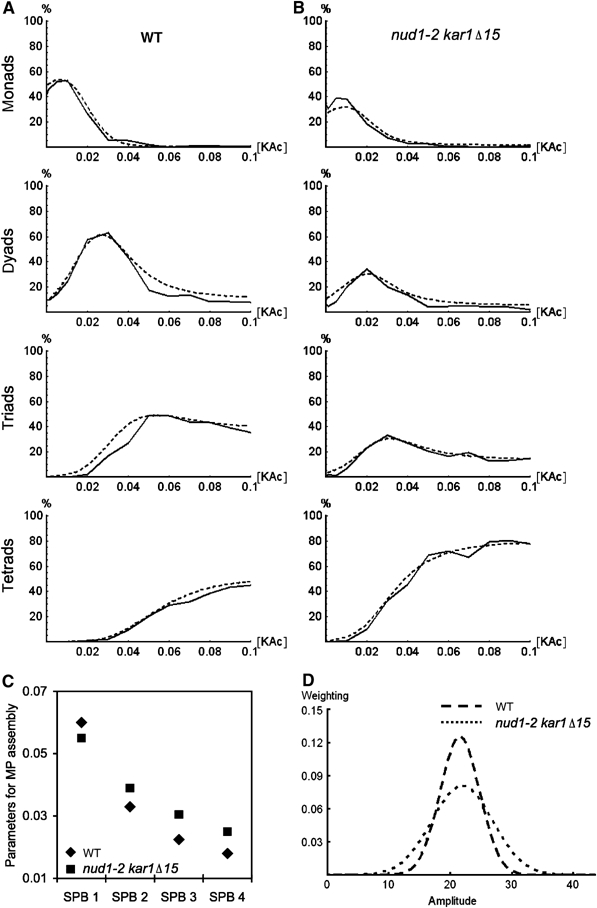
Analysis of the nud1-2 kar1Δ15 mutant sporulation profile using computer simulation. (A) Sporulation profile of the wild-type (WT) strain (YKS32; solid lines) and the simulated sporulation profile (dashed lines). (B) As (A), but for the nud1-2 kar1Δ15 mutant (YOG66). Note that the profiles were recorded at 30°C, in order to match previously established conditions for the recording of sporulation profiles. (C) Graph showing the four parameters that were derived by fitting the model to the experimental data and that describe the ability of four SPBs to promote MP assembly; for the WT and the nud1-2 kar1Δ15 double mutant. (D) Graph showing the Gaussian distributions that resulted from fitting the simulation. These distributions describe the variation of MP component production level in the yeast population.