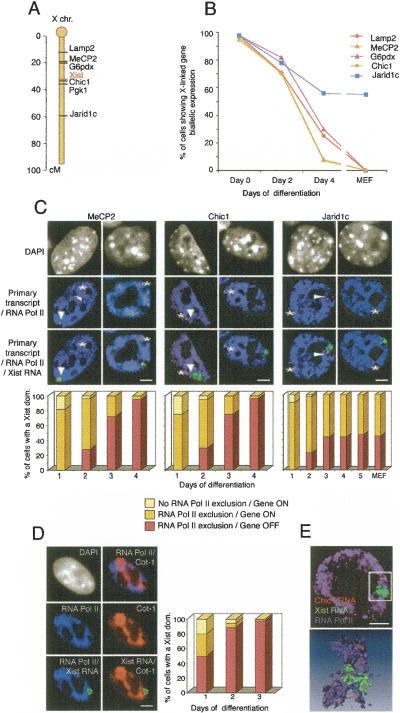
Figure 2.
Exclusion of the transcription machinery occurs earlier than the transcriptional repression of three X-linked genes during X inactivation. (A) Locations of the Lamp2, MeCP2, G6pdx, Xist, Chic1, Pgk1, and Jarid1c genes on the X chromosome. (B) Kinetics of repression of Lamp2, MeCP2, G6pdx, Chic1, and Jarid1c during X inactivation (n > 50 at every time point). The percentage of cells with Xist RNA domains (except at day 0) showing biallelic expression of different X-linked genes is shown in ES cells differentiated for 0, 2, or 4 d, as well as in MEFs where X inactivation has been completed. (C) Representative IF of RNA Pol II (H5 Ab; blue) combined with Xist RNA FISH (green) and RNA FISH showing the primary transcript of three X-linked genes (MeCP2, Chic1, or Jarid1c; red) on female ES cells at day 2 (left column) and day 4 (right column) of differentiation. Arrowheads show primary transcripts on the inactive X chromosome, whereas asterisks indicate primary transcripts on the active X chromosome. DNA is stained with DAPI (gray). Bar, 5 μm. Relative kinetics of RNA Pol II exclusion and gene repression during X inactivation on female ES cell undergoing differentiation (day 1, n = 60; following days, n = 100). (D) Representative IF for RNA Pol II (H5 Ab; blue) combined with Cot-1 (red) and Xist (green) RNA FISH on female ES cells at day 2 of differentiation. Arrowheads show the exclusion of RNA Pol II and Cot-1 RNA on the Xist RNA domain. DNA is stained with DAPI (gray). Bar, 5 μm. Relative kinetics of RNA Pol II exclusion and Cot-1 repression during X inactivation on female ES cell undergoing differentiation (day 1, n = 60; days 2 and 3, n = 100). (E) Example of 3D analysis of RNA Pol II IF together with Chic1 and Xist RNA FISH in early differentiated ES cells, using Metamorph software (top) and after Amira reconstruction (bottom).

