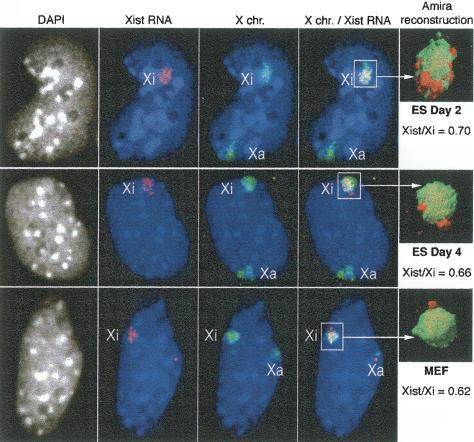
Figure 4.
Comparative analysis of the relative volumes of Xist RNA domain and X-chromosome territory during X inactivation. Xist RNA FISH (red) combined with an X-chromosome paint DNA FISH (green) on female ES cells undergoing differentiation (days 2 and 4) and MEFs. 3D analysis using Amira software reconstruction (n = 30). DNA is stained with DAPI (gray or blue). Bar, 5 μm. Relative volumes were calculated using Amira software and are shown on the right of each panel.

