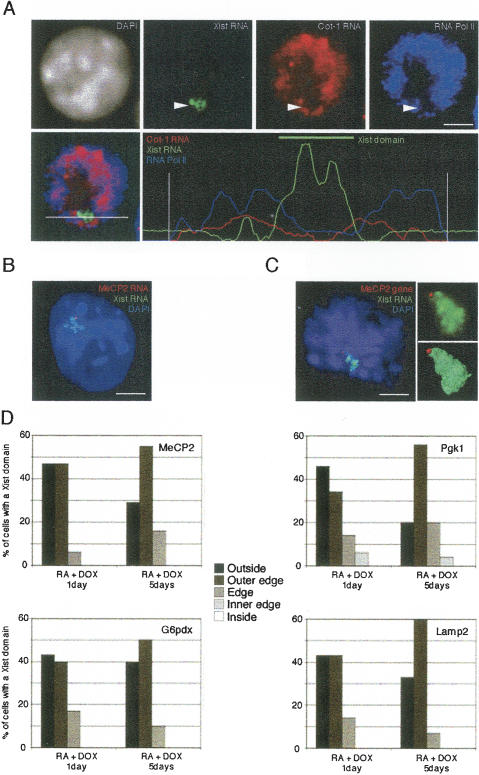
Figure 5.
Role of Xist RNA A-repeats using an inducible Xist gene. (A) RNA Pol II immunostaining (blue) combined with Cot-1 RNA FISH (red) and Xist RNA FISH (green) in 30–24–46 male ES cells after 2 d of differentiation and Doxicyclin-induction of XistΔA RNA transcription. DNA is stained with DAPI (gray). Bar, 5 μm. A line scan shows the relative intensities of the three signals across the nucleus. The large and the small peaks of Xist RNA likely correspond to the bulk of the X chromosome and the transcribed Xist locus itself, respectively. (B) Dual RNA FISH for MeCP2 RNA (red) and Xist RNA (green) following 1 d of differentiation and XistΔA expression. DNA is stained with DAPI (gray). Bar, 5 μm. (C) Representative 3D analysis of MeCP2 DNA FISH (red) combined with a Xist RNA FISH (green) using Metamorph software and Amira reconstruction, after 5 d of differentiation and XistΔA expression. DNA is stained with DAPI (gray). Bar, 5 μm. (D) Distribution of the different profiles of MeCP2, G6pdx, Lamp2, and Pgk1 locations with respect to the Xist RNA domain (based on the categories described in Fig. 3) after 1 or 5 d of differentiation and XistΔA expression (n = 30). No statistical differences in position distributions between days 1 and 5 are found.

