Figure 5.
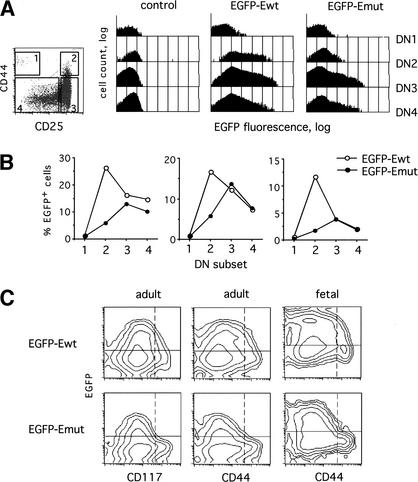
EGFP reporter expression in the earliest thymocyte subpopulations. (A) Thymocytes were stained with a cocktail of mAb to lineage markers, and the lineage-negative thymocytes (1%–2% of the total) were gated on the basis of CD44 and CD25 expression as shown on the density plot at the left. Shown are the histograms of the EGFP fluorescence in the gated DN thymocyte subsets (DN1–DN4) from a control nontransgenic mouse or from representative transgenic mice. The logarithmic scale was used on the Y axis to facilitate comparison between the different subsets. (B) Mice from three independent transgenic lines of each type were stained as above, and the percentage of EGFP-positive cells was determined in each DN subset. Control wild-type thymocytes contained <0.5% positive cells in each subset. The representative staining results are shown as pairwise comparisons between the EGFP–Ewt (open circles) and EGFP–Emut (filled circles) lines with similar levels of overall EGFP expression. (C) Adult or 16.5 days postcoitum (dpc) fetal thymocytes from the same transgenic lines as in A were stained with mAb to the lineage markers, CD25 and either CD44 or CD117. Shown are contour plots of EGFP versus CD117 or CD44 fluorescence in lineage-negative CD25+ cells encompassing subsets DN2 and DN3. Horizontal lines show the baseline EGFP fluorescence in nontransgenic control mice, and vertical dashed lines define the CD44/CD117high (DN2) subset.

