Figure 6.
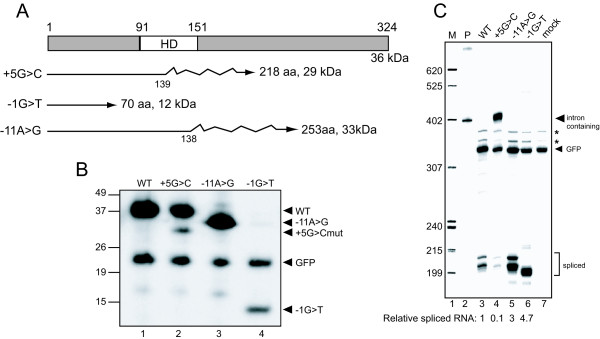
Analysis of protein expression from mutant minigenes. A. The domain structure of PITX2c protein with the position of the homeodomain (HD) is shown. Lines below represent the proteins that would result from aberrantly spliced RNA caused by each of the mutations. Straight lines indicate normal protein and jagged lines indicate incorrect amino acids generated by frame shifts; the number of normal amino acids and full-length size is shown for each. B. Western blotting of indicated FLAG epitope-tagged PITX2c and GFP proteins expressed in HEK293 cells. WT, protein from a wild type minigene transfection; +5G>C, protein from IVS4+5G>C mutant minigene transfected cells; -11A>G, protein from IVS5-11A>G mutant minigene transfection; -1G>T, protein from IVS5-11A>G mutant minigene transfected cells. The positions of wild type, +5G>C, -11A>G, and -1G>T PITX2 protein, and GFP protein, are indicated at the right. C. RNase protection assay (RPA). RNA from the indicated transfections was subjected to RPA with the same probe used in Figure 5, protected products were resolved on a 6%–8 M urea polyacrylamide gel, and a phosphorimage was obtained. Correct PITX2c splicing generates a ~206 nt band and GFP generates a 309 nt band. M, 32P-labeled pBR322/MspI markers with sizes indicated on the left; P, undigested probes; mock, RNA from GFP-transfected cells. The positions of correctly spliced and GFP protected products are shown at the right. The asterisks denote artifact bands derived from the GFP probe. The multiple bands for spliced product are likely due to incomplete RNase digestion. Below the lanes is quantitation of splicing relative to WT as assessed by PhosphorImager analysis.

