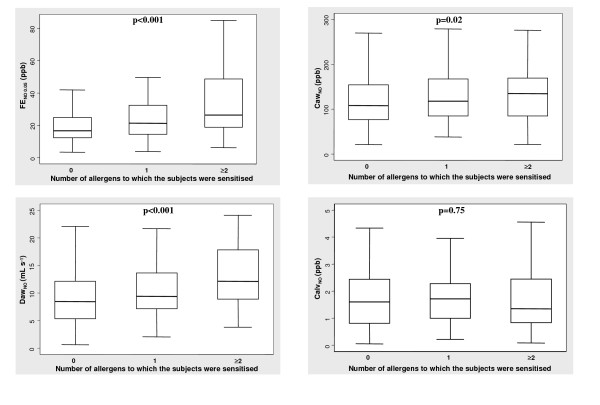
Figure 1.
Exhaled NO and flow-independent airway NO exchange parameters in relation to the degree of sensitisation, assessed by the number of allergens to which one person was sensitised. Box-plot explanation: upper horizontal line of box, 75th percentile; lower horizontal line of box, 25th percentile; horizontal bar within box, median; upper horizontal bar outside box, upper adjacent value; lower horizontal bar outside box, lower adjacent value

