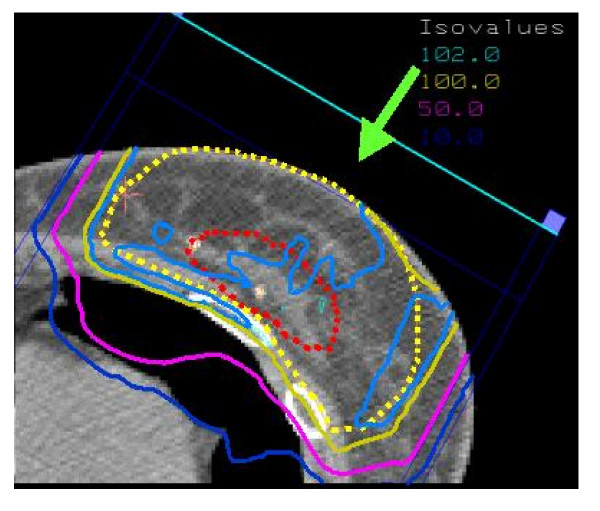
Figure 3.
Dose distribution (protons) in an axial CT slice through the center of the breast for an early breast cancer patient treated with partial breast irradiation. The isodose contours are represented by different colors (corresponding values are displayed on the upper-right border of the figure).

