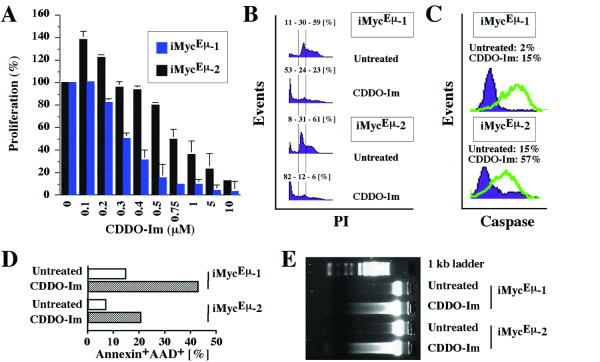
Figure 2.
CDDO-Im-dependent growth arrest and apoptosis in iMycEμ-1 and-2 cells. A, MTS assay of cell proliferation, demonstrating growth inhibition in iMycEμ-1 and-2 cells by ≥200 nM and ≥500 nM CDDO-Im, respectively. Low concentrations of CDDO-Im (100–200 nM) caused growth promotion in iMycEμ-2 cells by an unknown mechanism. B, Cell cycle arrest and increased number of cells with sub-G0/G1 DNA content, as determined by FACS. The percentage values shown above the histograms indicate the fraction of cells with sub-G0/G1, G0/G1 and S/M DNA content, respectively. C, FACS analysis of cells containing activated caspase 3 upon treatment with CDDO-Im (green lines) or left untreated (purple histograms). D, FACS analysis of CDDO-Im treated cells (open columns) and untreated cells (striped columns) undergoing apoptosis based on annexin V and 7-AAD reactivity. E, Fragmentation of genomic DNA detected by electrophoresis in an agarose gel stained with ethidium bromide.

