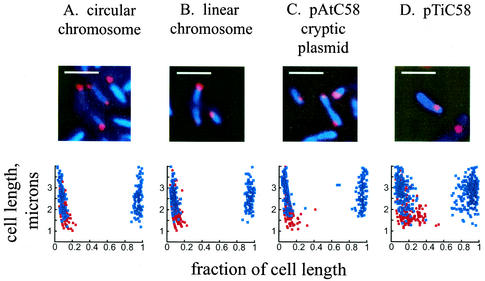
FIG. 1.
Localization of A. tumefaciens origins of replication by FISH. Red, probe signals from the origin sequences; blue, DAPI staining of the nucleoid. Graphical representations of the cellular positions of the origin are shown below the FISH staining. A minimum of 100 cells was counted for each graph. Red dots, origin positions in cells with a single focus; blue dots, origin positions in cells with two foci. Zero and 1 on the x axis represent the poles of the cell. Bars, 2 μm.

