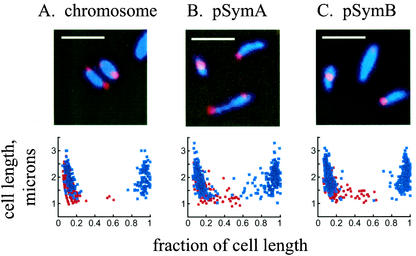
FIG. 2.
Fluorescence micrographs and graphical representation of origin localization by FISH in S. meliloti. Red, probe signals from the origin sequences; blue, DAPI staining of the nucleoid. Red dots, origin positions in cells containing a single focus; blue dots, origin positions in cells with two foci. Zero and 1 on the x axis represent the poles of the cell. Bar, 2 μm.

