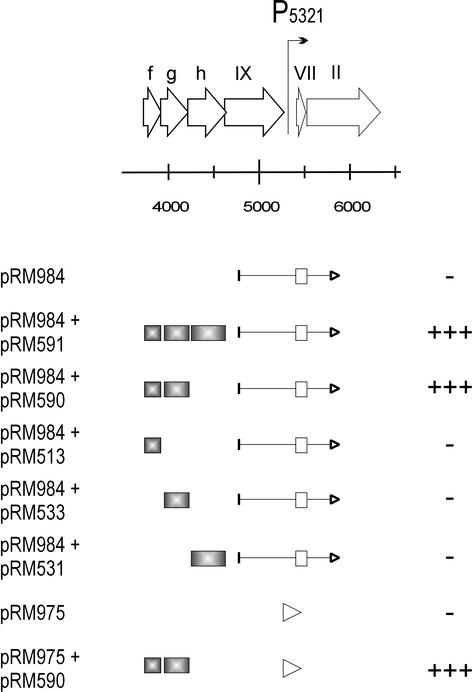
FIG. 7.
Analysis of the promoter P5321 with the potential activators by the CAT assay. The PM2 genome region from nt 3716 to 6332 is illustrated at top of the figure. Genes and ORFs are depicted with open arrows indicating the direction of transcription. The location of the promoter P5321 in the genome is indicated with a bent arrow. Below are indicated the genomic fragments, which were used in the promoter activity assay. ORFs and genes are marked with boxes, and an arrowhead points to the direction of transcription in the CAT fusion construct. The plasmids are denoted on the left. The assay was performed with either a long genomic fragment or the 134-bp promoter region cloned into the CAT reporter vector (pRM984 and pRM975, respectively). The possible regulators (shaded gray) were cloned into another compatible vector. For the level of the CAT expression (plus and minus signs), see the legend to Fig. 3.

