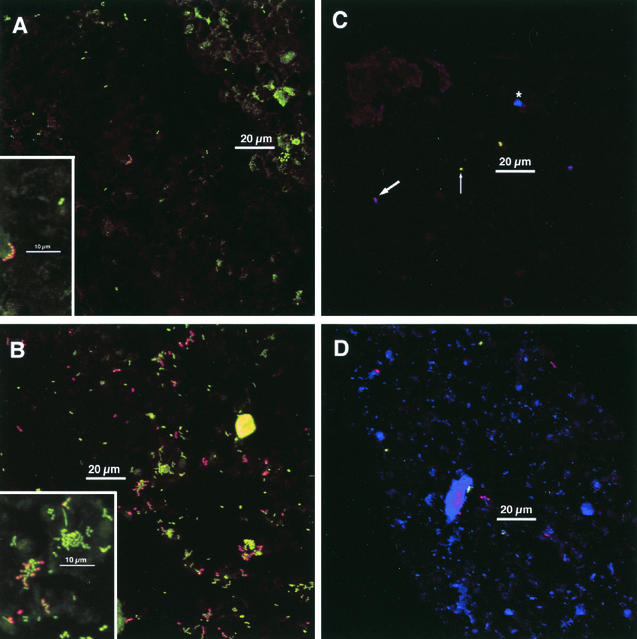
FIG. 2.
Typical colonization after 4 h of appliance wear. Insets: electronic zoom of center region. (A and B) Staining with acridine orange (green), anti-RPS (red), and anti-type-1 (blue). (A) Sparse colonization. Chain of anti-RPS reactive cells in center; cluster of acridine orange-stained cells at lower right of scale bar. Most cells are not antibody reactive. No anti-type-1-reactive cells are visible. Marked enamel autofluorescence in upper right. Inset shows homogeneity of anti-RPS reactivity within the chain of cells. Anti-RPS reactive cells are characterized by a yellow center (green plus red) and orange-to-red edges. A pair of antibody-unreactive cells (only acridine orange staining) is visible. Other dim greenish material is debris or enamel autofluorescence. (B) Heavier colonization. Most cells are in clusters. Many anti-RPS-reactive cells. Inset shows anti-RPS-reactive cells together with acridine orange-stained cells within a mixed microcolony. (C and D) Staining with anti-DL1 (green), anti-RPS (red), and Syto 59 (blue). These images show different fields of view from a single chip. (C) Very sparse colonization. Antibody-RPS-reactive cells are purple (red plus blue; thick arrow), whereas anti-DL1-reactive cells are green (limited uptake of Syto 59; thin arrow; see text for details). A cluster of three antibody-unreactive cells (Syto 59-stained; blue; asterisk) is between scale bar and upper edge. (D) Heavier colonization. Several anti-RPS reactive cells (purple) and a few anti-DL1 reactive cells (green) are visible, but most cells are not antibody reactive (blue). Debris or enamel fluorescence (large blue regions) is visible. Maximum projection images of simultaneous-acquisition three-channel confocal stacks. Low-magnification images are shown; dimensions are 158 μm on a side and 25,000-μm2 total area (approximately 1/10 of the total chip area).

