Figure 2.
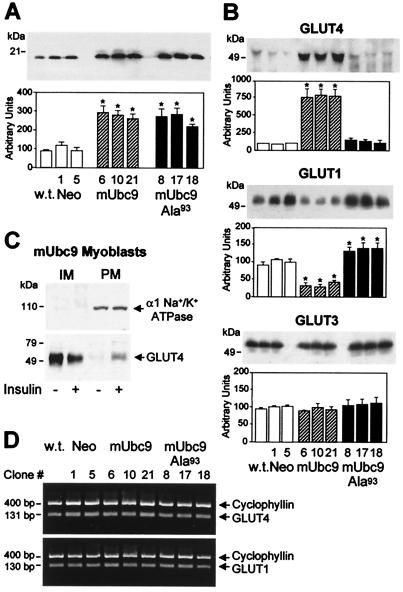
Regulation of glucose transporters by mUbc9. (A) Overexpression of mUbc9 cDNA in L6 myoblasts. L6 cells were left nontransfected (wild type, w.t.) or stably transfected with plasmids encoding mUbc9 (mUbc9, clones 6, 10, and 21), mUbc9 with mutation of Cys93 to Ala (mUbc9-Ala93, clones 8, 17, and 18), or the G418 resistance gene alone (Neo, clones 1 and 5). Total cell lysates (10 μg) were analyzed by immunoblotting with anti-mUbc9 antibodies (Upper), and the amount of mUbc9 protein was quantified in multiple experiments (Lower, mean ± SE of five experiments). *, P < 0.05 vs. Neo, clones 1 and 5, and w.t. by unpaired Student's t test. (B) Effects of mUbc9 or mUbc9-Ala93 overexpression on GLUT4, GLUT1, and GLUT3 protein levels in L6 myoblasts. Total cellular membranes (10 μg) from wild-type (w.t.), Neo, mUbc9, or mUbc9-Ala93 myoblasts were analyzed by immunoblotting with anti-GLUT4, anti-GLUT1, or anti-GLUT3 antibodies. A representative transporter immunoblot and the quantification of multiple immunoblots (mean ± SE of three experiments) are shown for each. *, P < 0.05 vs. Neo, clones 1 and 5, and wild type by unpaired Student's t tests. (C) GLUT4 transporters in L6 myoblasts overexpressing mUbc9 exhibit insulin-regulatable translocation to the cell surface. IM (10 μg) and PM (10 μg) from basal or insulin-stimulated (1 μM) cells (clone 10) were analyzed by immunoblotting with antibodies to the α1-subunit of Na+/K+ ATPase, as a plasma membrane marker (Upper), or GLUT4 (Lower). IM and PM were depleted or enriched, respectively, in α1 Na+/K+ ATPase. GLUT4 levels in IM and PM fractions from Neo or mUbc9-Ala93 myoblasts were very low (not shown). (D) Unaltered GLUT4 and GLUT1 mRNA levels in nontransfected (w.t.), Neo, mUbc9, and mUbc9-Ala93 myoblasts. Total RNA (10 ng) was subjected to reverse transcription–PCR analysis for determination of GLUT4, GLUT1, and cyclophyllin (coamplified in each reaction as a control for amplification efficiency) mRNA levels.

