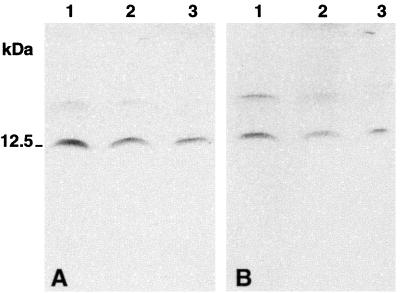
Figure 2.
Western blot after Tricine-SDS/PAGE of rat tissue extracts immunostained with antiserum K42 (A) and antiserum K605 (B). (Lane 1) duodenum; (lane 2) colon; (lane 3) hypophysis. Note the predominant immunoreactive band of ≈12.5 kDa in the rat hypophysis, duodenum, and colon (positive control). The tissue extraction procedure yielded a faintly immunoreactive band at 17 kDa. The low molecular mass markers from Novex (San Diego, CA) were used for the molecular mass calibration.

