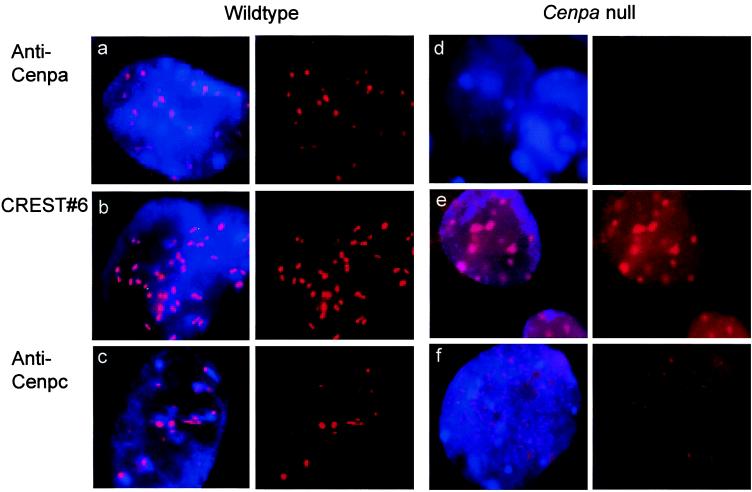
Figure 4.
Immunofluorescence analysis of day-5.5 embryos. (a–c) Wild-type interphase cells stained with anti-Cenpa, CREST#6 autoimmune serum, and anti-Cenpc, respectively. (d–f) Cenpa null interphase cells stained with anti-Cenpa, CREST#6, and anti-Cenpc, respectively. Although these pictures represented the results taken at one focal plane of a three-dimensional interphase cell nucleus, direct microscopic analysis through all the planes indicated only variation in the total number of observable signals but not the morphology of the signals (e.g., the more diffuse spots in e, and the higher background signals throughout the nuclei in both e and f compared with their respective controls). (Left) Simultaneous staining of chromatin with 4′,6-diamidino-2-phenylindole (blue) and centromere with anticentromere antibody (red). (Right) Split image of Left showing anticentromere antibody staining (red) only.

