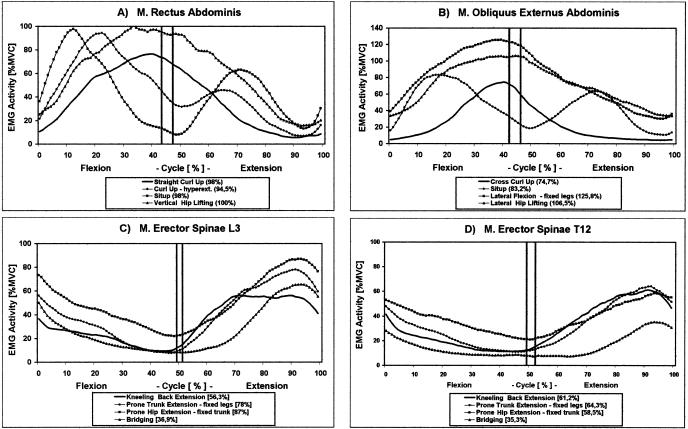
Figure 4.
A through D, Time and maximal voluntary contraction–normalized electromyogram activation profiles (n = 10) of 4 target muscles in selected trunk exercises. The curves are based on individual average curves of 8 repetitions. The vertical lines indicate the range for point of return in these exercises. The peak activation value of each curve is specified in parentheses after each curve name. The corresponding mean values for each period and exercise are listed in Figure 3

