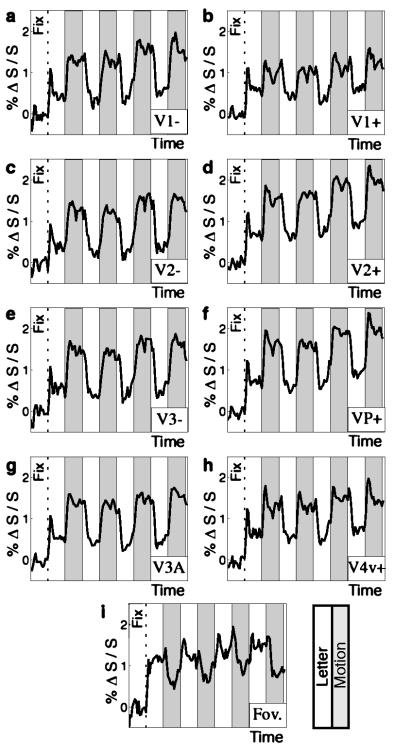
Figure 3.
Time course data by cortical area, averaged across subjects (n = 12 hemispheres) for attend foveal letters vs. attend extrafoveal motion. (a–h) Mid-eccentricity ROIs in V1−, V1+, V2−, V2+, V3−, VP+, V3A, and V4v+ exhibited greater activation during attend-extrafoveal-motion epochs. (i) Confluent foveal representation (e.g., red region of Fig. 2b) exhibited greater activation during attend-foveal-letters epochs.

