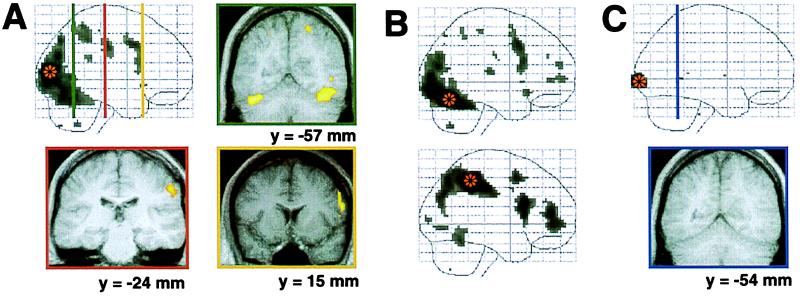
Figure 3.
Coactivation maps during rivalry. (A) Areas where activity was significantly correlated with that in BA 18/19 (P < 0.01, corrected) are shown as through-projection onto a lateral representation of standard stereotactic space (Upper Left). Regional activation in selected coronal slices is overlaid onto the average Talairach normalized anatomical MRI of the six subjects. Distance from the anterior commissure is indicated below each coronal section and, through color coding, on the Upper Left lateral representation. (B) Areas where activity was significantly correlated with that in posterior fusiform gyrus (Upper, x = 42, y = −69, z = −18) and superior parietal cortex (Lower, x = 39, y = −42, z = 45) are shown as through-projection onto a lateral stereotactic representation (P < 0.01, corrected). (C) Only a few distal voxels in posterior cortices show significant correlation with V1. Markers on the see-through representations indicate the loci of activity used as regressor in the covariation analyses.

