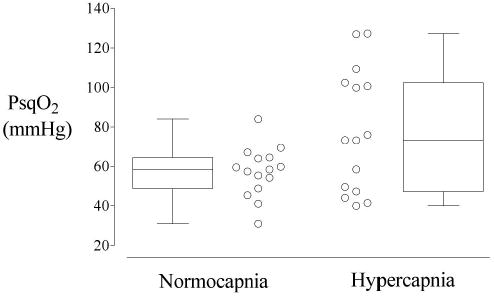
Figure 1.

Subcutaneous tissue oxygen tension (PsqO2) averaged over the entire operation for each patient (open circles) and then summarized with a box and whisker plot for each treatment group. The Normocapnia group had an end-tidal PCO2 of 35 mmHg (n=15). The Hypercapnia group had an end-tidal PCO2 of 50 mmHg (n=15); the FIO2 in both groups was 80%. The difference between the groups was statistically significant, P = 0.029.
