
Figure 1.
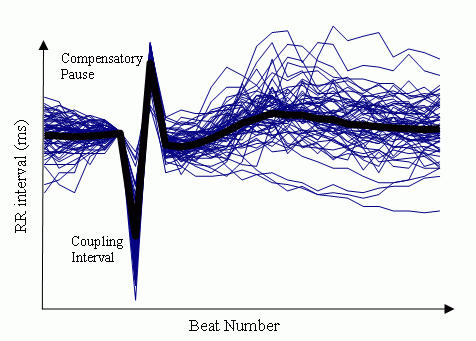
Example of RR interval sequences in one patient (thin lines), all aligned at the VPC. The thick line shows the average of the 60 sequences. Figure supplied courtesy of Dr. Georg Schmidt.
Official websites use .gov
A
.gov website belongs to an official
government organization in the United States.
Secure .gov websites use HTTPS
A lock (
) or https:// means you've safely
connected to the .gov website. Share sensitive
information only on official, secure websites.
Example of RR interval sequences in one patient (thin lines), all aligned at the VPC. The thick line shows the average of the 60 sequences. Figure supplied courtesy of Dr. Georg Schmidt.