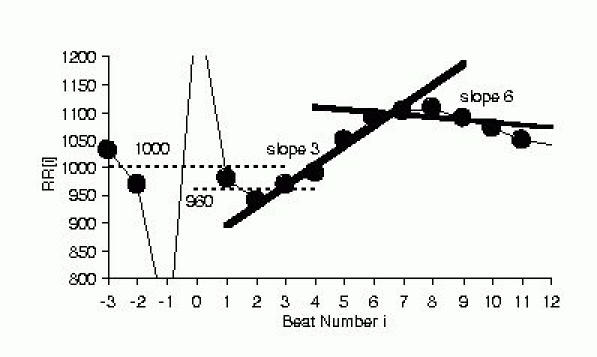
Figure 2.

Schematic figure showing measurement of TO and TS. TO is the difference in the average of the 2 RR intervals preceding and succeeding the VPC/compensatory pause sequence expressed as a percentage. In the example shown, TO= - 4% from 100 x (960-1000)/1000. TS is the maximum of regression slopes computed for 5 consecutive RR sequences. In the example, the regression lines for beats 3~7 (slope 3) and beats 6~10 (slope 6) are shown, and TS was 36.4 because slope 3 had the largest slope of 36.4 ms/beat number among slopes 1 through 16.
