
Figure 3.
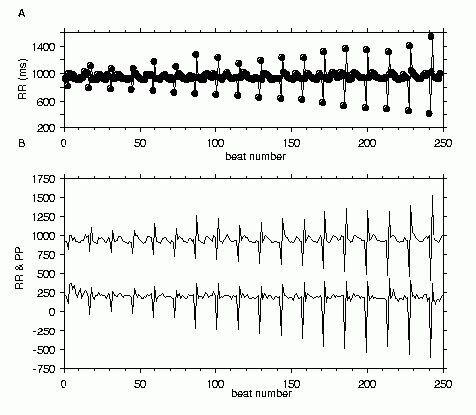
Induced HRT. Panel A. RR intervals from a patient undergoing clinical electrophysiology study for supraventricular tachycardia. A stimulus was delivered at the RV apex after 20 sinus beats at various coupling intervals shorter than the baseline RR interval. Only the RR for the 2 beats before and 10 beats after the extrastimulus and compensatory pause are shown for each extrastimulus. Panel B. The RR data from panel A and pulse pressure (systolic - diastolic blood pressure) for the same beats are shown together. The pulse pressure was multiplied by 10 and shifted down by 800 mmHg so as not to overlap with the RR data.