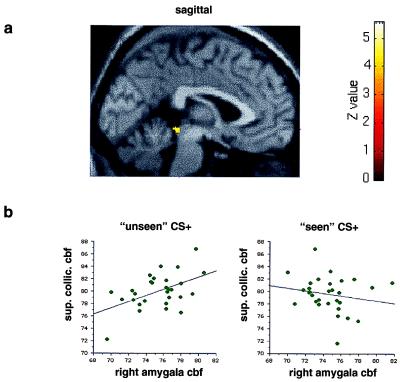
Figure 4.
(a) An SPM showing a region in the superior colliculus that exhibits a positive covariation with the right amygdala specifically during presentation of the masked CS+ faces. The same analysis and threshold was used as in Fig. 3a. The region of covariation in the superior colliculus is displayed on a sagittal section (y = 0) of a canonical structural MRI. (b) Graphical displays showing bivariate regression plots of activity in right amygdala and superior colliculus. The graph on the left plots right amygdala CBF (in ml/dl⋅min−1) in the maximal right amygdala voxel (x = 18, y = −2, z = −28) and maximal collicular voxel (x = 0, y = −36, z = −8) during presentation of the masked (“unseen”) CS+ faces. The graph on the right plots right amygdala CBF values for the same voxels in the unmasked condition. Regression lines have been fitted to the data.

