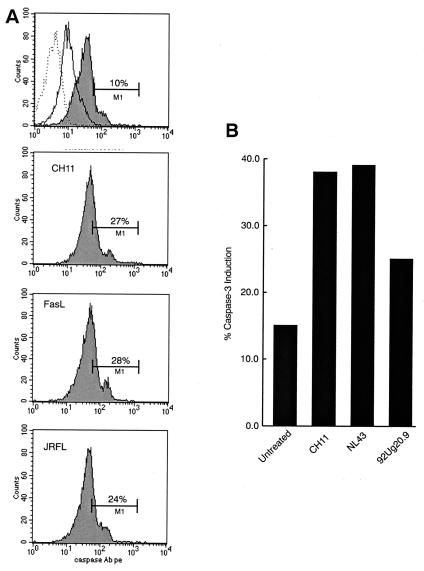
Figure 1.
Induction of caspase-3 activation determined by immunostaining. Flow cytometric analyses of PBMCs untreated or treated with anti-Fas mAb CH11, FasL, or HIV-1 JRFL envelope are shown in A. Additional results are presented in B with HIV-1 NL43 and 92Ug20.9 envelopes and with anti-Fas mAb CH11. In the histograms in A, mean channel fluorescence (mcf) is displayed on the x axis and total cell counts on the y axis; the gate was set on the CD3+ population. The dotted line represents unstained cells, the solid line represents the isotype control, and the shaded areas show anti-active caspase-3 staining. The marker boundary (M1) was set to exclude background staining in the untreated cells (Top); the percentage of cells with mcf values above the marker boundary is indicated in each histogram. (B) mcf values over background are presented as determined for A.

