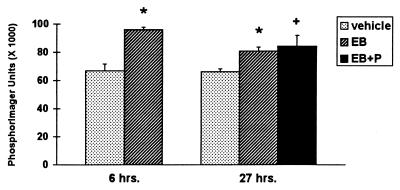
Figure 4.
Effect of E and P on pituitary Hsc73 mRNA levels. Total RNA from individual animals in each treatment group was subject to Northern analysis. The x axis indicates the time of sacrifice after a single injection of hormone or vehicle. For the EB + P group, P was injected 24 h after EB, and the animals were sacrificed 3 h later for a total treatment time of 27 h. Quantitative analysis was performed as described in Fig. 3B. Each bar represents the mean ± SEM. ∗ indicates a significant difference (P < 0.05) between vehicle- and EB-treated animals. + indicates a difference (P < 0.10) between vehicle- and EB + P-treated animals.

