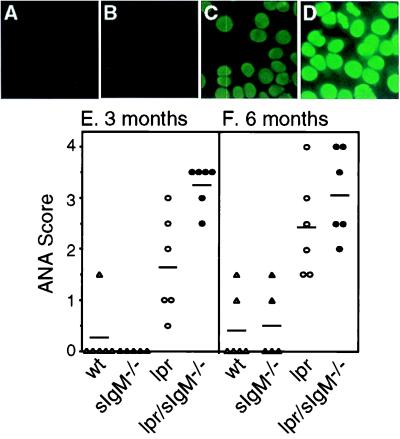
Figure 2.
Comparison of the levels of ANA among various types of mice. (A–D) Representative ANA stains of fixed HEp-2 cells with sera (1:150 dilution) from 3-month-old wild-type (wt), sIgM−/−, lpr, and lpr/sIgM−/− females (×40). (E and F) ANA scores of wt, sIgM−/−, lpr, and lpr/sIgM−/− mice at 3 and 6 months of age, respectively.

