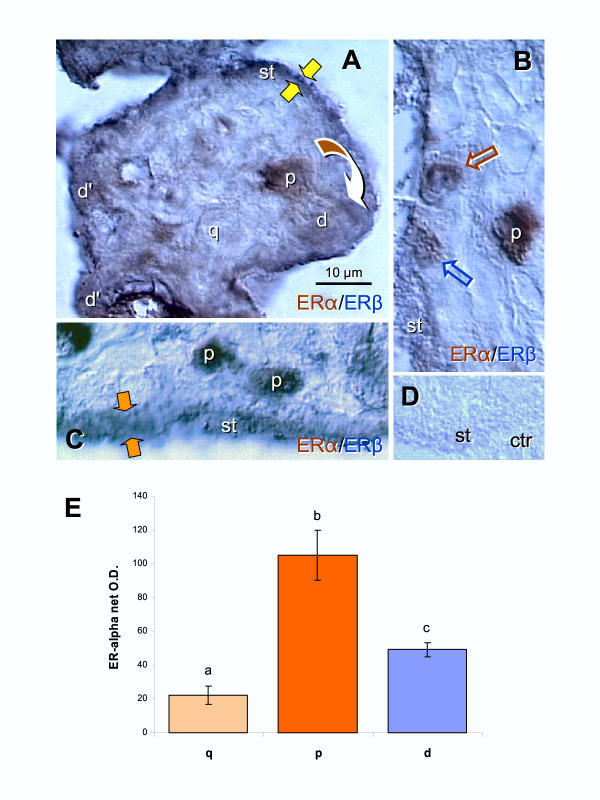
Figure 3.
Dual color immunohistochemistry for ERα (brown) and ERβ (dark blue) in CV. [A] Dividing CT cell (arched arrow) shows strong ERα staining (brown color) in the parental (p) cell and depletion in the daughter cell (d) merging with ST. A quiescent CT cell (q) shows weak nuclear ERα staining. Additional "daughter cells" shoving brown/blue color transition are indicated as (d'). Dark blue (ERβ) staining dominates mature ST (st). Yellow arrows indicate very narrow ST. [B] Strong brown nuclear ERα immunoreactivity of parental CT cell (p), and gradual diminution of ERα and increase of ERβ in daughter cells (brown and blue arrows) merging with ERβ+ (blue) ST. [C] Dividing CT giving rise to two parental cells with high ERα immunostaining. Orange arrows indicate relatively wide ST. [D] Control. [E] Quantitative evaluation of ERα immunoreactivity in quiescent, parental and daughter cells. Each column represents mean from six net O.D. measurements ± SD. Different column superscripts indicate significant difference. Details in text.

