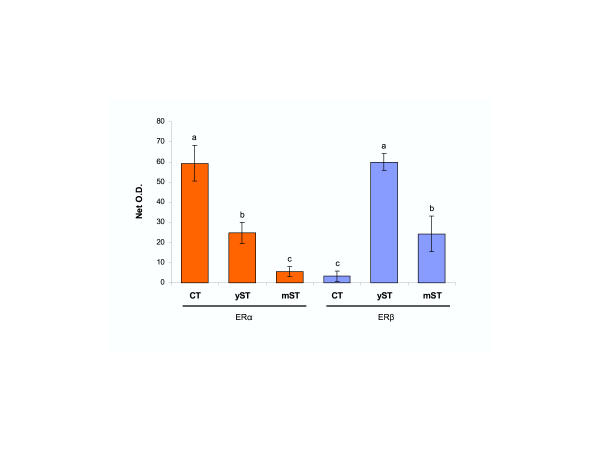
Figure 5.
Quantitative evaluation of ERα and ERβ immunoreactivity in late trophoblast cultures. CT, cytotrophoblast; yST, young ST; mST, mature ST (see Fig. 4 for examples). Each column represents mean from six net O.D. measurements ± SD. Different column superscripts indicate significant difference. Details in text.

